The complexity of the world increases every day. We tend to build more, deploy more, and handle more and more data. We split our applications into smaller microservices and deploy them many times a day. This makes more and more moving parts and makes us automate everything.
However, sometimes things may break. When this happens, we need to troubleshoot the issues as soon as possible to make things right and not lose customers’ trust. To streamline our work, we use many tools that can help us pinpoint issues and alert us when things start to break. One of them is monitoring.
Unfortunately, monitoring is simply not enough. Let’s see why, what we need instead, and how to get it together.
Monitoring Focuses on Quantity
Monitoring solutions focus on bringing as much data as possible to let you reason about the important stuff. This is great – many things get integrated automatically. We can extract metrics from operating systems, infrastructures, clouds, servers, runtimes, networks, and many more computer systems. Once we get the data points, we can visualize them to draw charts and graphs showing us how systems evolve. Thanks to OpenTelemetry, we can bring the data from nearly everything nowadays.
The problem is data is not enough. We need reasoning.
Monitoring solutions do not bring reasoning. They just swamp us with data points and let us go and figure. We need to do the hard work to understand where the problems started and what was the cause. The only thing monitoring solutions give us is pointing where the fire is. They don’t show us how it started, what was the actual reason, and how to solve the issues.
There can be many reasons why the problems started. Maybe we deployed new things that are broken. Maybe the input data distribution changed. Or maybe we just installed some operating system updates that caused troubles. We don’t know that when using monitoring. We need something better.
We Need Understanding Instead of Seeing
We need tools that can explain what happens. They should give us more than just “CPU load spiked”. They should provide explanation of what happened in our environments and whether the increased load is a problem that we solve in the software, configuration, or in the hardware.
To do that, we need systems that can connect data from various areas of the Software Development Life Cycle. We need to get a holistic view of code changes, CI/CD pipelines, deployments, configuration changes, schema migrations, and input data distribution. Once we have that, we can explain that the “recent query change caused the SQL query to not use index anymore which caused the CPU load to spike”. Once we have such an explanation, we understand that we can fix the index
How to Get the Data
We must capture things from all the parts of SDLC. Let’s see some of them.
The first area is the application code. We need to get information on how our applications interact with databases and whether they do things right. We need to extract execution plans and check if queries use indexes and efficient filtering. By examining execution plans we can tell if things will work well in production and we can tell that very early in the development phase.
Next, we need to analyze how our databases evolve. We need to check schema migrations and how fast they execute. It’s easy to modify the schema when the database is small, but it may take hours in a production system. We need to verify that in advance without risking deploying the faulty code.
Then, we need to analyze the configurations, statistics, extensions, and settings of our production systems. We need to check how they change, whether they are consistent between environments, and if they give the best performance.
Finally, we need to build observability around live database activities. We need to see queries as they come to the database, the execution plans, and how the database handles the traffic. Once we have all that, we can finally build an understanding of how things perform.
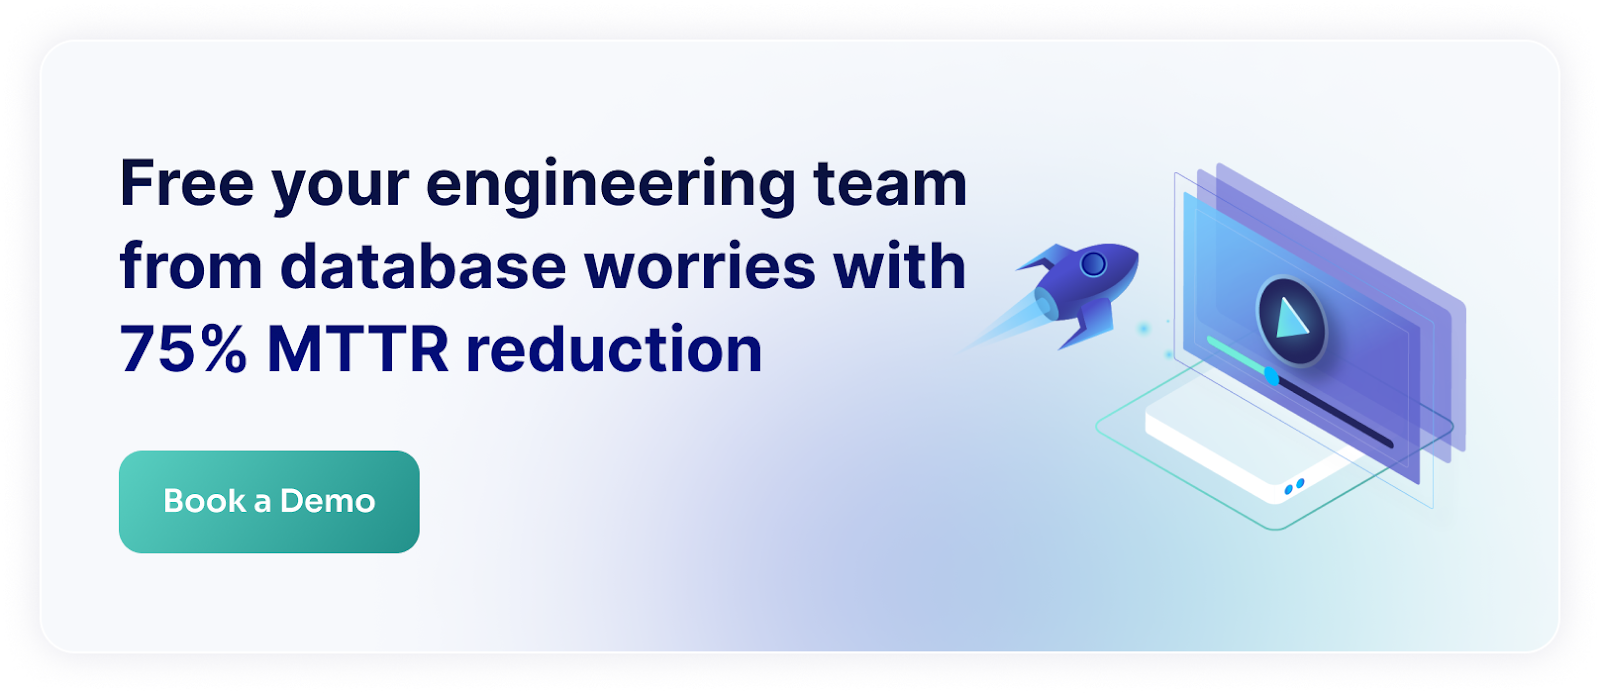
Use Metis to Get an Understanding
Metis gives you all that understanding. It uses observability tools to connect all your areas of SDLC to give you a clear explanation of all the changes happening in your system.
Metis helps developers to reason about their databases while they develop the code locally. Metis analyzes queries, extracts the execution plans, and provides actionable insights into how to make things faster.
Metis analyzes schema migrations and can tell early if they will cause problems when run in production. This way we can avoid downtime and prevent the issues from happening.
Last but not least, Metis provides observability around databases. It extracts live queries and execution plans, detects anomalies, and alerts you whenever there is an issue that cannot be fixed automatically.
Summary
Monitoring is not enough. We can’t just see the data points and do the reasoning on our own. We need that automated. To do that, we need to build observability, include data points from all areas of SDLC, and finally give consistent explanations. Metis gives you all of that. You need to use it to work faster and cope with the complexity of today’s world.